How the Detroit Free Press is using personas to better gauge readers’ interests
Tyler Davis and Brian Manzullo, Detroit Free Press,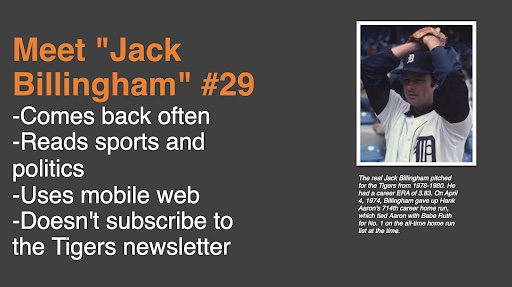
This is an example of a user persona created for a Tigers subscriber who is named after a real Detroit Tigers player.
Here’s an idea to steal and adapt: Consider your readers not just as political junkies or sports nuts, but as multi-dimensional people who love politics and are enamored with baseball (or both). When you do that, you can open readers to a wide range of different coverage they didn’t know you had.This is a series on Better News to a) showcase innovative/experimental ideas that emerge from the Knight-Lenfest Newsroom Initiative and b) share replicable tactics that benefit the news industry as a whole. This “win” comes from Tyler Davis, former assistant sports editor of the Detroit Free Press, and Brian Manzullo, social, search and audience editor of the Free Press, which participated in the Major Metro Table Stakes in 2018 and the digital subscriptions sprint cohort for TS alumni in 2022.
Question: What communities do you serve and what can you tell us about the history of your organization?
Answer: The Detroit Free Press primarily serves southeast Michigan, with a focus on the Detroit metro area. Our coverage area includes Wayne County, where Detroit is located, along with Oakland, Monroe, Livingston, Macomb and Washtenaw counties. The Free Press was founded in 1831 and has gone through a few ownership changes, all while winning 10 Pulitzer Prizes and multiple Emmys. It is in a joint operating agreement with the Detroit News, the other major newspaper in the city.
Q: What problem were you trying to solve, and why was solving the problem strategically important for your organization?
A: Reader retention. How do we, in the newsroom, positively affect retention? How do we keep more of the people who would otherwise end their subscription? This is important because the Free Press, which implemented a subscription model in August 2020, has been successful in acquiring new subscribers. We wanted to learn more about keeping those subscribers and thinking of ways (other than good journalism) we can use to encourage them to stick around. Growing our number of subscribers and building a strong relationship with them (i.e. retaining them as paying subscribers) is key to our company’s financial outlook.
Q: How is this approach related to Table Stakes (e.g. one of the 7 Table Stakes and/or an outgrowth of the Knight-Lenfest initiative, etc.)?
A: Our approach relates directly to Table Stake No. 4 (“Funnel occasional users to habitual and paying loyalists.”) By focusing on one group of subscribers, we could better envision their journey through the funnel and come up with tactics to strengthen that journey to loyalty.
Q: How did you go about solving the problem?
A: We isolated a cohort of readers who subscribed to read Detroit Tigers MLB coverage during spring training weeks (mid-February to late March). We started by looking at readers who read a Tigers story on the same visit that they subscribed; this included before or after buying a subscription. We pulled in the anonymous ID that Google Analytics attaches to each subscriber, then matched that to our subscriber database to create a cohort.
We partnered with audience experts within Gannett to produce a dashboard that showed us the reading behaviors of that cohort, which included more than 600 people.
We assigned names to the readers to identify them more easily, using the names of past Tigers greats. We then began bucketing subscribers into high-usage readers, “zombies” (those who hardly interact) and those in the middle (seemingly on the cusp of becoming a highly engaged reader, and thus, more likely to become a long-term subscriber).
To solve our problem, we had to gain a better understanding of our subscribers as a whole, and acquire information that helps us learn more about them.
For example, the local basketball fan may also be a mother interested in education coverage – but she only thinks of you as a sports source. A season-ticket holder to the football team may be looking for things to do on Sunday evenings in the city – but he’s never clicked on your entertainment page when reading your game recaps. You can’t assume people are already enjoying your diverse selection of journalism; you should be bringing it to them from all angles.
We had to identify the KPIs that represent better retention (daily page views, website visits, newsletter subscriptions) and establish a baseline of activity, how much we wanted that activity to grow, then find a way to track this by reader.
From there, we were able to test some strategies to build retention, mostly by using breakout links to encourage those reading Tigers stories to read non-sports stories, as well.
We also surveyed some of those readers to get feedback on what we could be doing better. And finally, we sent email blasts asking subscribers to also subscribe to our newsletter (our dashboard and surveys revealed very few of those fervent Tigers readers were subscribed to our weekly Tigers newsletter).
Q: What worked?
A: We proved we can isolate a cohort of subscribers, something that hadn’t been done here, and learn from them.
One of our Tigers subscribers, for example, reads a couple of stories and then comes back multiple times a day to check game scores. That is something we’d hoped but hadn’t been able to see in that detail before.
We think, to some extent, the linking also worked. Parse.ly data showed that breakout links to politics, entertainment and education stories were clicked on by multiple people reading Tigers stories. There is a thought among sports editors and reporters that our readers don’t want to see non-sports stories, that they come to us to get away from the “real news” of the day. But we were proved wrong.
No one has complained about the entertainment or investigative or education link plopped high in a Tigers story, and we do see some increased engagement. From April to July, there was a 17% increase in page views per session from these Tigers subscribers.
Q: What didn’t work?
A: Our first attempt at surveying the cohort via an incentivized email prompt did not go well, as we received too few responses to make substantial observations.
We were hoping to learn more about the cohort with the survey, including their interest level in non-Tigers coverage, their satisfaction level with our different types of Tigers coverage (game stories, columns, etc.) and whether they were happy with their Free Press subscription.
We have attempted to survey again, this time using a combination of email prompts and direct links to the survey inside our Tigers story, to garner more feedback.
Q: What did you learn about the audience you targeted?
A: We knew that our audience was interested in sports coverage, but we learned that they are interested in other topics, as well.
Breaking news events and politics seemed to be areas of interest for our Tigers cohort. We had expected more interest in entertainment, but that didn’t bear out. There was interest in entertainment coverage, but it was outpaced by political coverage, which surprised pretty much everyone.
We also learned that many of our readers don’t take advantage of our newsletters, and many of our readers (more than a quarter of this cohort) are very loyal and read multiple stories each day.
That made some of our goals of improving page views and visits per day rather hard to meet. (It’s very difficult to get someone who’s reading 4-6 stories a day to read even more!) This observation caused us to shift our focus from raising raw numbers to trying to 1) get more engagement from those who read infrequently (by showing them different coverage) and 2) get more people subscribing to our newsletters.
Q: You did this work as part of a 5-month program focusing on improving digital subscription growth and retention. How did having a limited amount of time encourage you to try new things?
A: All of this was new to us. The condensed nature of the sprint forced us to learn on the fly in terms of building and reading the dashboard and making up the survey. It also meant we had less margin for error, so we had to be intentional and consistent in our effort of in-story linking and tracking metrics.
Q: What would you do differently now?
A: If we were to assemble a new cohort, we would first find a distinctive way to label our users in a dashboard and create columns within the dashboard that tell us what we would like to learn about them. This would help us to understand the parameters of what we can see about our readers and it would help to speed up the cohort-building process.
We would start with the same information that we tracked, which was visits per session, page visits and types of articles that were read. But we would also target and track demographic qualities, such as ZIP code information, household income, level of education, race and age. This second layer of data would help us to understand our audience better and craft our coverage to fit their needs.
Q: What advice would you give to others who try to do this?
A: Plan, plan, plan. Set deadlines for different actions (when you want to start breakout linking; when you want to send out a survey; what timeframes you are considering when analyzing data and why) and try to focus on what your goals are as finely as possible. There will be a ton of information at your fingertips and many ways to interpret it; be clear about what you’re looking for so you’re not overwhelmed.
Assess your resources early. You will be surprised about the skills that people in your newsroom have. Once all of those skills come together, you can conduct “first of its kind” studies that can be used across the company and make coverage better.
Also, think about demographic and geography data along the way. Think about how you can take your data a step further by looking at race, ethnicity, ZIP codes, and other defining characteristics of your readers.