How nonprofit education news site EdNC built its own loyalty tracker
Nation Hahn, EdNC,This is a series on Better News to a) showcase innovative/experimental ideas that emerge from the Knight-Lenfest Newsroom Initiative and b) to share replicable tactics that benefit the news industry as a whole. This “win” comes from Chief Growth Officer Nation Hahn of EdNC.
Question: What problem were you trying to solve, and why was solving the problem strategically important for your organization?
Answer: Our work with the Knight-Lenfest Newsroom Initiative at the University of North Carolina helped us re-orient our work around our audiences’ needs, which are “first, foremost and paramount.”
At the top of the funnel, we were good at attracting and delivering content to our audiences, but we needed to work on our mid-funnel tactics (getting our audiences to stay) as well as the bottom of our funnel (including long-term engagement and financial support).
Our performance challenge was to better understand our existing audiences and build new ones, and we began changing our decision-making to better serve them. We started by building an engagement dashboard and then including a more intentional review of our analytics and audience surveys into weekly meetings with the goal of “continually experimenting to improve results.” Our development of individual, team, and organizational scorecards, plus one-on-one interviews and focus groups with key stakeholders, allowed us to think about loyalty and what matters most to us organizationally. This process gave us clarity about how we could define “deep engagement” or loyalty.
It quickly became apparent that loyalty is different for different types of content, reporters, newsrooms and stakeholders. We needed a way to track loyalty in a way that wasn’t static, using tools that didn’t exist.
Q: How is this approach related to Table Stakes (e.g. one of the 7 Table Stakes and/or an outgrowth of the Knight-Lenfest initiative, etc.)?
A: Our challenge focuses on Table Stake #4: Funnel occasional users to habitual and paying loyalists.” We decided to build a loyalty tracker — that visualizes the funnel concept — into our engagement dashboard.
We created a loyalty score to track the depth of engagement for each reader in our audience. It allows us to view in real time where we stand with individual readers and our audience collectively. It allows us to produce content and develop mid-funnel tactics that will include redesigning our website and email newsletters to move people toward deeper engagement over time.
Q: How did you go about solving the problem?
A: EducationNC reaches people through our website, newsletters, social media, and through Reach NC Voices — a platform we built that includes our own capacity to email and text people in communities across North Carolina. (For a deeper read on Reach NC Voices, see this Solution Set story from the Lenfest Institute.) While we had built our engagement dashboard in a way that allowed us to observe our audiences within each silo, we weren’t looking at them in an integrated fashion across all of the different ways they choose to interact with our content.
When we started thinking about loyalty it became clear we needed a holistic way to understand each reader individually and our audience as a whole. It was fairly obvious: In our newsroom, we consider a reader who reads five articles and opens five newsletters equally loyal to someone who reads 10 articles over the course of a month. Yet due to the fractured nature of our analytics, we couldn’t precisely quantify that.
Our data scientist, Bryan Noreen, created the ability to track readers from multiple sources of data. As we did this, we started thinking about how much we value and score each form of engagement. We learned loyalty was different for different types of content, different reporters and different stakeholders. This led us to imagine and create a tool that would allow the reporter or the newsroom to choose how loyalty is measured. As they determine the weight of each potential action, the formula produces and visualizes a loyalty score.
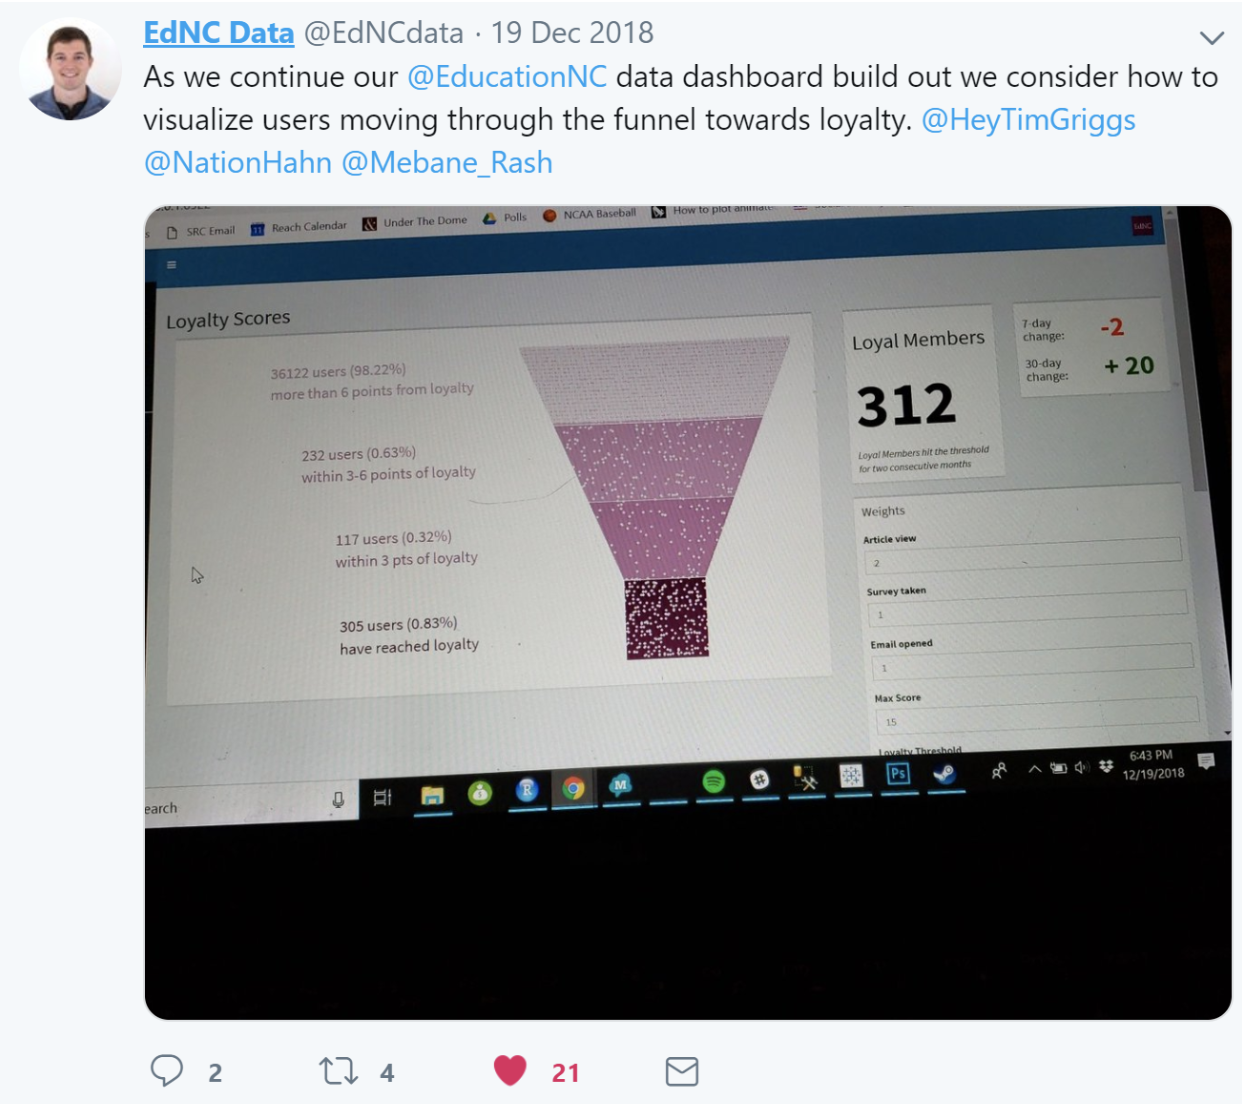
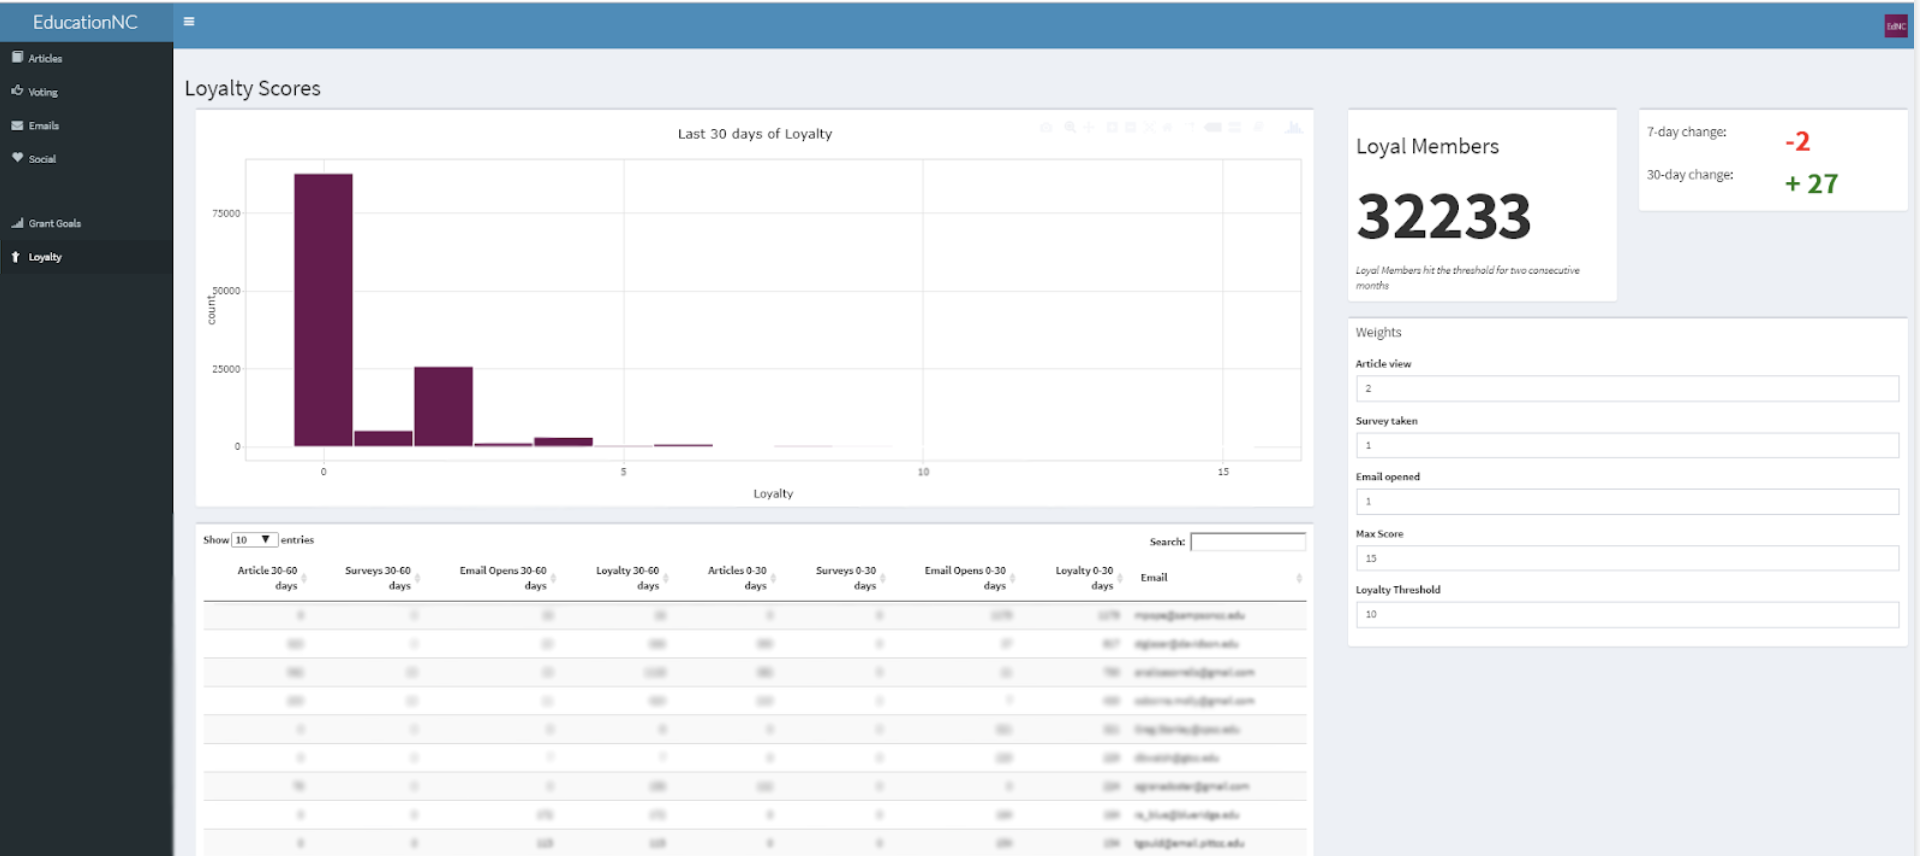
Here’s how it works: The newsroom can set a value for each article read, email opened and survey taken. Each reader receives a certain number of points assigned for each action. At the same time, the newsroom can set a goal for how many points a reader must get to be considered loyal. Our formula then goes to work. If any given reader gets enough points for two consecutive months, then they are deemed loyal.
In the example below, an article is weighted with two points, while surveys and emails are weighted one point. Readers who receive 10 points for two consecutive month are classified as loyal. For example, someone who reads two articles (four points), takes two surveys (two points), and opens four emails (four points) would hit the loyalty threshold that month. If they did the same again the next month, then they would be considered loyal.
Q: What worked?
A: We built both a process and a tool allowing us to better understand our audiences, shifting how we make decisions around content and using tactics to increase the number of readers who are deeply loyal and engaged.
Our loyalty tracker allows us to evaluate engagement in each silo and across multiple silos. Are people who read articles taking surveys or opening emails? How can we shift newsletter sign-ups to get site viewers more engaged? Do survey takers read articles also? We want people to engage with us across all of our work, and this allows us to see how people are doing that, and in turn, helps us make decisions to increase crossover.
Focusing on loyalty indicators has made a huge difference in many ways. One example: From August to November of 2018, we saw a 50 percent uptick in site traffic from the same time period the year before.
Q: What didn’t work?
A: The loyalty tracker is still in development. Our organizational leadership is using the information currently to inform our work, but reporters and teams are still being trained on how to use the dashboard to inform the creation of content day to day. In addition, some of the social channels and email platforms don’t allow us to integrate their analytics, which leads to a still incomplete picture of loyalty.
Q: What happened that you didn’t expect?
A: The loyalty tracker was originally built by our data scientist in four days as a minimum viable product (MVP). We’ve spent the past several months iterating on it, including building out additional features. Having an MVP allowed us to get feedback quickly, build the feedback into our design thinking process, secure investments from funders, and expedite development.
The combination of our own capacity to email and text, our CRM (customer relationship management) tool, and the loyalty tracker has led to other media organizations asking about whether this suite of tools could be shared or licensed. We’re now exploring how to customize our engagement tools so they’re user-friendly for others.
Q: What would you do differently now? What did you learn?
A: In retrospect, we could have built the loyalty tracker into our real-time engagement dashboard from the beginning. Moving forward, we also need to update the look and feel of the tracker and build in additional features allowing us to determine how many users are ‘close’ to being defined as loyal and develop targeted strategies to move them to deep engagement. And we didn’t focus enough on the UI/UX of the dashboard in the early days. Our entire team needs to use the dashboard, which would be aided by an easier and more fun(!)-to-use dashboard.
Q: Anything else you want to share about this initiative?
A: Ultimately, the tool only provides a benchmark. The real work, and success, comes from digging into your team’s strategies and identifying what you can do to improve loyalty for your all important audience.