Publish continuously: Assessing the gaps in your newsroom
Douglas K. Smith, Quentin Hope, Tim Griggs, Knight-Lenfest Newsroom Initiative,This is an excerpt from “Table Stakes: A Manual for Getting in the Game of News,” published Nov. 14, 2017. Read more excerpts here.
Gaps: Shortfalls in continuous, responsive digital publishing
Consider each of the statements below. Answer “yes” if the statement is either entirely or mostly true for your newsroom. Answer “no” if it is not true at all or only to minor degree.
| Yes | No | ||
| 1. Our editorial meetings are scheduled at the same times they were two to three years ago. | |||
| 2. We spend most of our time in editorial meetings on story selection and placement for print. | |||
| 3. Our newsroom starts to fill-up around 11 a.m. and really comes to life in the afternoon. | |||
| 4. Our reporters think in terms of what their daily and weekly output should be for print but don’t have the same sense of how much and how often they should be publishing digitally. | |||
| 5. Stories have print deadlines but not separate digital deadlines. | |||
| 6. A majority of our digital posts for the day are published after 5p.m. | |||
| 7. Our daily budget covers only print. | |||
| 8. Our budget includes some digital publishing but the budget tool is print-based. | |||
| 9. Our workflows tie to print publishing deadlines and/or our print CMS. | |||
| 10. Less than half of our reporters and editors can build and publish a complete digital story (e.g. with headline, SEO head, text, tags, photo, hyperlinks, embeds). | |||
| 11. Most of our digital production and publishing work is done by dedicated digital producers and audience “specialists” rather than our newsroom’s reporters and editors. | |||
| 12. Little special attention is given to headlines for digital posts; the print headline usually suffices. | |||
| 13. Stories are “held for print” (e.g. the Sunday paper) for good print reasons but without corresponding arguments for digital publishing first. | |||
| 14. Our reporters know how many stories they’ve had on A1 last month but couldn’t say for sure how many of their stories were in the top 10% of page views, unique visitors or time spent. | |||
| 15. Management may not be aware that the website was down for a time but would certainly know if a press run finished an hour late. | |||
| 16. More of our staff time is spent specifically on print production than on digital production and publishing. | |||
| 17. Key staff (e.g. visual specialists) are pulled for days at a time to work on big projects that appear only in the print edition. | |||
| 18. Major enterprise, investigative or other editorial projects are conceived and planned with print foremost in mind; the form, timing and promotion of digital publication happens late in the game. | |||
| Add up the number of “yes” marking to get your assessment score.
The higher your score the bigger your gaps. |
Total: | ||
Note: The statements in this assessment are based on observed practices at newsrooms that have not yet reached the Table Stakes for continuous and responsive digital publishing.
To calibrate your own score, ask others in the newsroom to take it as well and then meet together to compare answers on individual items and overall scores. Use the ensuing discussions to calibrate your gap assessment and develop a shared understanding of the nature of your gaps.
Gap: Identify the misalignment between your target audiences’ news consumption patterns and your publishing schedule
Identifying this misalignment – and monitoring it – is a key discipline for:
- Using the audience data you have available to get a clear view of the usage patterns and habits of your audience;
- Tracking your posting timing to see how well it matches your audience’s patterns; and,
- Constantly looking for gaps and opportunities to better match your publishing timing to the usage patterns.
In doing this over time your newsroom will develop a keen sensibility for staying in sync with your audience.
Start by:
- Picking a long enough period of time to smooth out weekly variations (e.g. the last 4-6 weeks)
- Determining and graphing the number of posts (URLs) published to your primary platforms (website and mobile sites or apps) by hour for weekdays, Saturdays and Sundays separately.
- Pulling and graphing your traffic data for unique visitors to these same platforms by hour for the same time period, again separating weekdays, Saturday and Sundays.
- Overlaying these two sets of graphs to see how well your current posting times align with your unique visitor traffic patterns on weekdays, Saturdays and Sundays. (See the earlier examples from Philadelphia and Minneapolis in Section 2).
If you wish to go deeper, you can also analyze and depict such gaps by:
- Device by weekdays, Saturdays and Sundays
- Finer time periods – e.g. weekdays between 6 a.m. to 9 a.m. in quarter hours
- Facebook posting to your main Facebook account versus when unique visitors arrive via Facebook
- Major traffic sources beyond Facebook – e.g. search, other social referrals, etc.
Finally, an important nuance to consider: Try to find data for overall audience traffic patterns in your market – that is, not just your own audience traffic. Why? Because your current traffic may not reflect the full picture. For example, your mismatch gaps along with other factors could provide a distorted picture if the traffic coming to your sites differs significantly from the news seeking behavior of the target audiences you wish to serve. Anything you can do to get a fuller picture of overall audience traffic patterns in your local market will give you a more accurate picture of your total market potential and current publishing gaps (e.g. data on leading local digital competitors).
Gap: Identify workflow performance gaps
Workflow performance gaps arise from unproductive step-by-step approaches to getting work done. For example, performance shortfalls arise from a workflow in which reporters complete stories for print first and only then either they or others (e.g. digital producers) make any changes or additions relevant to digital audiences. This print-first, digital-as-afterthought workflow can cause performance gaps related to extra time, misuse of resources, errors that require rework, lower quality audience experiences, and failure to capture traffic and engagement.
Identifying workflow performance gaps is tricky, though, because workflows, roles and skills, and technology and tools are highly interrelated. Look at the chart below:
Triangle of Interdependence
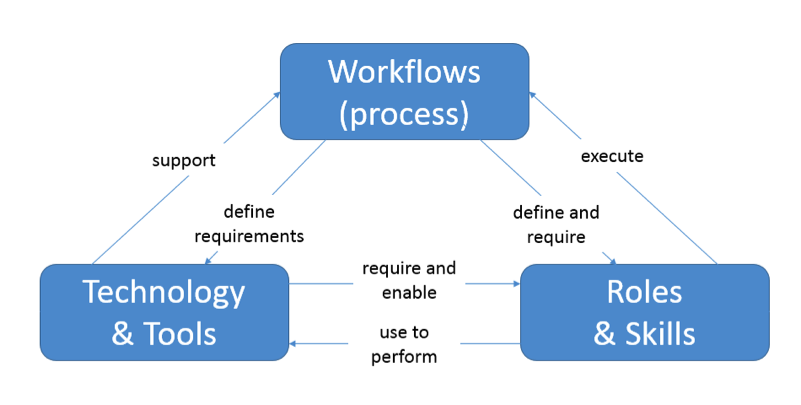
Notice that workflows require people in the right roles having the right skills and using the best technology and tools. If any part of this interconnected triangle is ineffective, the associated workflow suffers. For example, if technology and tools are weak (illustration: no universal budget), workflows become longer and more elaborate with workarounds and added steps, which in turn require more skills, experience and cleverness. Skills and workflow end up propping up the technology rather than being supported by it. And when skills are narrow (illustration: too few reporters can create a fully digital story), workflows are fragmented into more steps and handoffs that require extra coordination and supervision.
The opposite also holds: When more folks have deeper, more practiced skills, they can contribute to more roles – and the more roles folks can do, the fewer the workflow steps and handoffs required. Similarly, the better the tools and technology, the fewer the manual tasks required and the shorter and faster the workflow.
Getting all three elements aligned and in balance is essential to three dimensions of digital publishing performance:
- Speed and placement of audience-focused publishing to ensure your target audiences see your content when and where they are;
- Effectiveness of publishing to ensure every story has all the needed elements to attract and engage an audience, and that your newsroom quickly seizes on traffic trends and opportunities;
- Efficiency of publishing to insure your already constrained staff maximizes overall digital output at the best possible cost.
Failures in any of the three elements – workflows, roles-skills or technology-tools – lead to specific performance gaps in these three key elements – gaps that add time and delays to digital publishing, takes more resources, time and talent that could be put to better use, creates errors requiring rework, generates extra work in finding, checking or fixing content, lowers the quality of the output, delivers unengaging user experiences, or leads to the wrong output such publishing stories of little interest to an audience or unsuited to a platform.
To identify such workflow performance gaps, start by considering a “one person” workflow as a baseline. Today – as long as he or she has the right skills and technology – an individual can perform all the tasks of a digital publishing workflow. Indeed, this is the workflow used by digital natives – folks who grew up with today’s technology – to publish in your local market – whether as a lone blogger with a loyal following, a digital-only startup largely replicating the one-person workflow across a digital native staff, or a savvy local TV newsroom that’s broken from its own broadcast-centric legacy.
Baseline one person digital publishing workflow
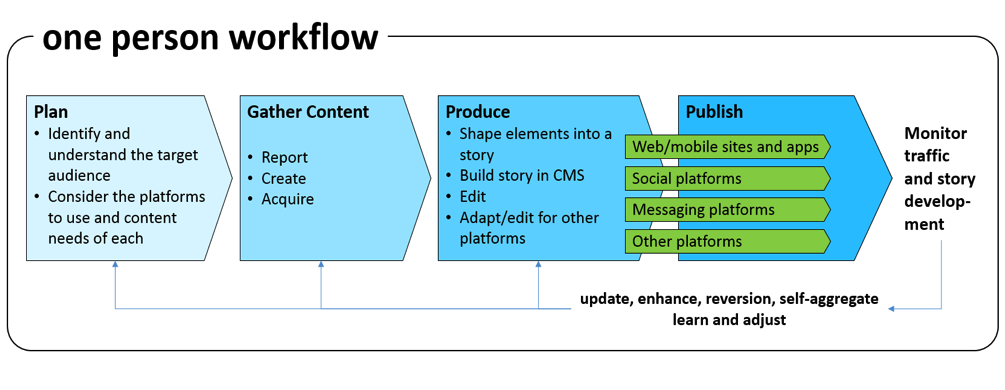
With this one person workflow in mind as a comparison, use the following steps to fully map out your current workflow and identify shortfalls and gaps:
10 steps for workflow mapping
-
Pick three or four people who collectively know the day-to-day workings of the newsroom. Get together in a room with lots of whiteboards or wall space for placing sticky notes and give yourselves a couple of hours of uninterrupted time.
-
Start with the workflow to publish a typical “daily” story. Make sure to include all the basic elements for the story, including those that are part of digital as well as others (e.g. text, photos, simple embeds, etc.).
-
Draw a box or use a sticky-note to identify the person who starts the story chain. If more than one person initiates the action, draw or use whatever number of boxes or notes are needed. Mark the title or position of the person in the box/note and list all the discrete tasks that person does before handing the story off to another person.
-
Add a box or sticky note for that next person and list all the specific tasks that person does before handing the story off to the next person. Draw the connecting arrow between the two boxes to show the direction of flow. Keep adding boxes/stickies for each person in the chain. If the process ever goes back to a person already included, still add a new box for them and list the tasks they do at that point in the process. Note: If you run into questions along the way about how things really work, check quickly with someone who knows. But don’t let that delay your work. Make notes of the questions and who to check with later and keep going to get a full first draft laid out. Similarly, keep track of any “ah ha” insights you have or problems you spot along the way but don’t stop to devise fixes yet. Keep focused on mapping the entire process to be sure you have whole picture first.
-
Any time information or story assets are put into an information system of any sort (even a WORD doc on a desktop computer) create a box or note for that system. List the information or assets that are created or put into systems and draw an arrow from the person inputting. Likewise, draw an arrow from the system to the person who accesses and draws the information out of the system. Note: It’s visually helpful to make the information system block a different shape (e.g. boxes for people and circles for systems) or the stickies a different color to distinguish systems from those for people.
-
When the process flow diverges for different platforms, show the branching with arrows and layout the sequence for each platform. If one platform loops back into or feeds another platform, show the connections. Note: Again, you can use different color stickies or a different shape to indicate a platform.
-
Don’t stop your process mapping with the publication of a story. As with the one person workflow, continute to map the steps involved in how traffic is monitored on the story as well as steps to promote, update or re-version story.
-
Once you have a first pass at the entire workflow, step back to review it to be sure it “flows” (even if poorly) and no steps are missing. If you logged questions along the way or think it needs another set of eyes, bring in others as needed to review it with them and make corrections as needed.
-
With the whole workflow before you, review it to identify significant delays between one step being completed and the next one being started and note the reasons (e.g., lack of capacity and “stacking up” at that stage, lack of information that something’s now ready for the next person to work on, slow systems processing or cycle times). Also identify causes for where the workflow breaks down (e.g. errors made in prior steps, missing information or story assets, lack of clear communications).
-
Make sure to fully capture your work. The easiest way is taking pictures that can then be used to recreate it in document form such as PowerPoint. (Be sure the shots are taken close enough to be able to read all the detail.). And, if possible, keep your whiteboard drawings or sticky notes up for a time to facilitate further conversation and problem solving. But, again, make sure to take the pictures in case someone unwittingly clears the board.
One you’ve laid out the workflow for a basic daily story, you can build on and differentiate it for other key efforts such as:
- An enterprise story incorporating more complex visual elements (heavily edited video, multiple graphics, interactives, etc.);
- A multi-part enterprise or investigative series that involves more extensive planning, editing and development of many multi-media elements.
In the course of mapping your basic workflow, you will come across some head-slapping moments of saying, “why do we do that?” – the sorts of questions that are often answered, “because we’ve always done it that way” without thought as to why or to what end. Mark those down – but keep going with the workflow mapping.
Once you’ve finished, collect all such questions and insights, then add to them by identifying additional gaps in adding value from an audience perspective as well as optimizing the efficiency and effectiveness of scarce staff and other resources.
To help, here’s a guide to common workflow issues:
| Area | Potential workflow gaps |
| Poor digital workflow design | Digital holds where content is first reviewed for print placement, published digitally only after print production is finished (published from print), and/or held for print-first publication without due consideration of the digital audience
Missing steps that limit the potential reach and engagement of digital stories (e.g. proper tagging and SEO headlines) or result in added work in later steps (e.g. steps for digital asset tagging and filing) Unnecessary steps that add little if any clear audience value and are habits carried forward from a different era Redundant steps where work is duplicated or redone without adding any clear audience value (e.g. added layers of editing) Missing information flows that should accompany process steps and hand-offs but don’t, resulting in errors or added work to loop back to get the needed information Lack of early planning involvement and adequate lead times with shared specialists’ resources that result in crash assignments and crunch workloads for individuals and delays in publishing other stories Missing feedback loops that could improve the audience focus, reach and engagement of future stories (e.g. audience traffic data, periodic reviews of story content and production) |
| Unclear or unperformed roles and responsibilities | Sloppy hand-offs due to a lack of definition of “clean handoff” requirements or poor execution by individuals, resulting in problems, added effort and publishing delays down the line (e.g. digital assets filing)
Lax enforcement of specified workflow steps and/or views that some steps are merely optional instead of required, resulting in suboptimal digital posts (e.g. lack of photos, missing tags) Passive or reactive communications rather than clear responsibility for proactive communications across the workflow, resulting in unnecessary points of confusion, frustration and conflict. Double work because two people think they’re responsible for the same thing (or don’t trust the other person to do it right or do it their way) |
| Skills limitations | Extra hand-offs because a person doesn’t have the skills to do the next needed steps (e.g. adding steps to involve producers and specialists because the reporter has few if any digital production skills)
Added inspection and rework steps to cover for the weak skills of individuals who can’t be counted on to do work at an acceptable level of quality (e.g. some editing steps). (Note that such work-around steps allow the weak skills to persist as part of the workflow rather than being addressed directly.) |
| Tools and technology limitations or absences | Extra steps required by working between multiple systems (e.g. cutting and pasting from a word processor to a CMS or from one CMS to another CMS)
Duplicative tasks from having to work in multiple unintegrated systems (having to enter the very same information in two different places) Fix-it steps to cleanup or add back items lost in the transfer of content between systems (e.g. having to redo hyperlinks) Workaround steps that overcome technology limitations and problems but would not be necessary with better technology Missing information due to a lack of universally used tools such as calendars and budgets that would provide one place to find all the information needed by any user at any step in the workflow. Processing delays and the resulting hang time caused by lack of CPU power, data transfers across systems and platforms, too infrequent of updating cycles, etc. |