Publish continuously: Measures of success and tracking progress in closing the gaps
Douglas K. Smith, Quentin Hope, Tim Griggs, Knight-Lenfest Newsroom Initiative,Three of measures of success arise from using digital first continuous publishing to better meet audience needs: 1) outputs achieved toward more continuous publishing; 2) outcomes achieved in audience growth by day part; and 3) capabilities built across the newsroom.
Tracking success at continuous publishing outputs
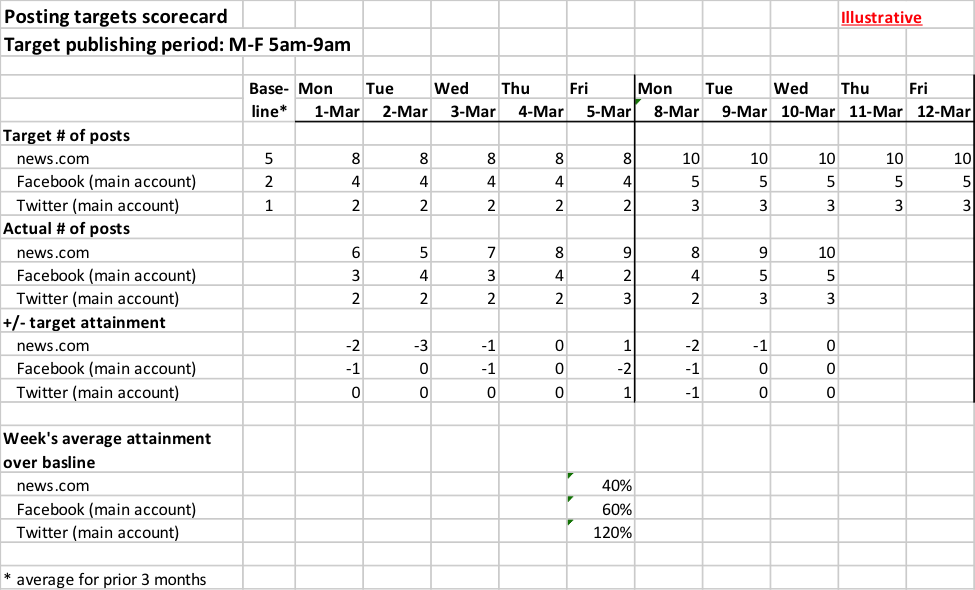
These direct and controllable measures focus on the execution of plans for continuous as well as increased amounts of publishing. The output being measured is straightforward – more posts published in the targeted daypart. Consider, then, a simple scorecard for tracking this against, say, a targeted period of weekdays between 5am and 9am:

Remember “what gets measured gets done.” It’s one thing to hear someone report, “I think we’re doing better at publishing more in the morning” and another to know that over the past month the postings increased by 10% between 5 and 9 a.m. on weekdays.
Tracking success at audience outcomes by daypart
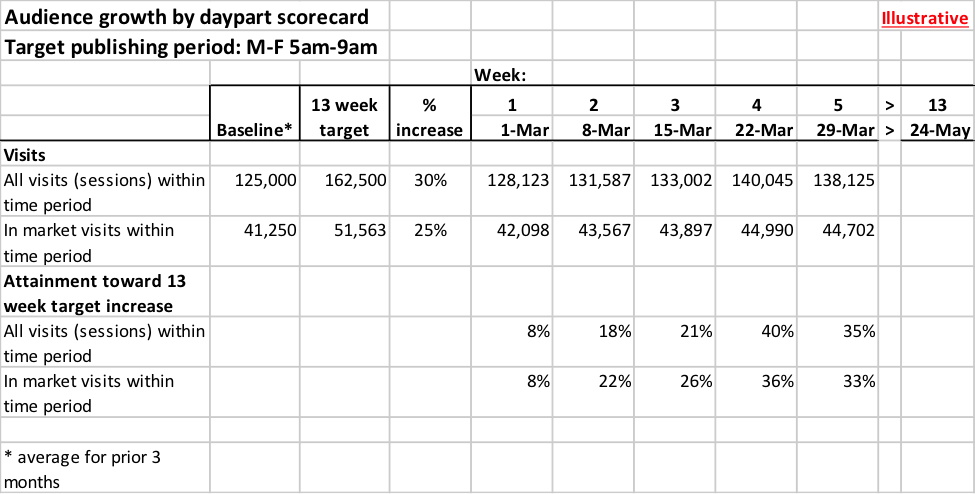
Increasing the targeted outputs for more continuous digital publishing is a key step toward achieving the real objective: namely, increased traffic and engagement arising from publishing fresh, relevant and engaging content during the times of day when audiences are seeking it. Think, then, about increased visits (sessions) across targeted dayparts. So, in addition to looking at audience numbers by day, week or month or by desk or reporter, a scorecard to monitor success at boosting publishing and visits during the Monday-Friday 5am to 9am morning daypart might look like this:

Obviously, you can tailor this scorecard to focus on different days and dayparts (e.g. Sundays from 6am to noon). You might do something similar for time of engagement, frequency of visits by the same user, source of traffic (direct, organic search, social referral, and other referral), and more.
Tracking success at capabilities built in the newsroom
Continuously publishing where and when audiences show up requires newsroom capabilities that blend work, workflows, roles, skills, technology and tools. So, it is key to be as rigorous in setting and tracking capability goals as it is audience growth and engagement goals.
For example, suppose your newsroom sets this objective:
Bring every desk to at least an 80% level of digital skills attainment and use for digital production “self-sufficiency”
You can devise a scorecard for this goal by:
- Defining the specific skills required for “self-sufficient” digital publishing by reporters and others in your newsroom.
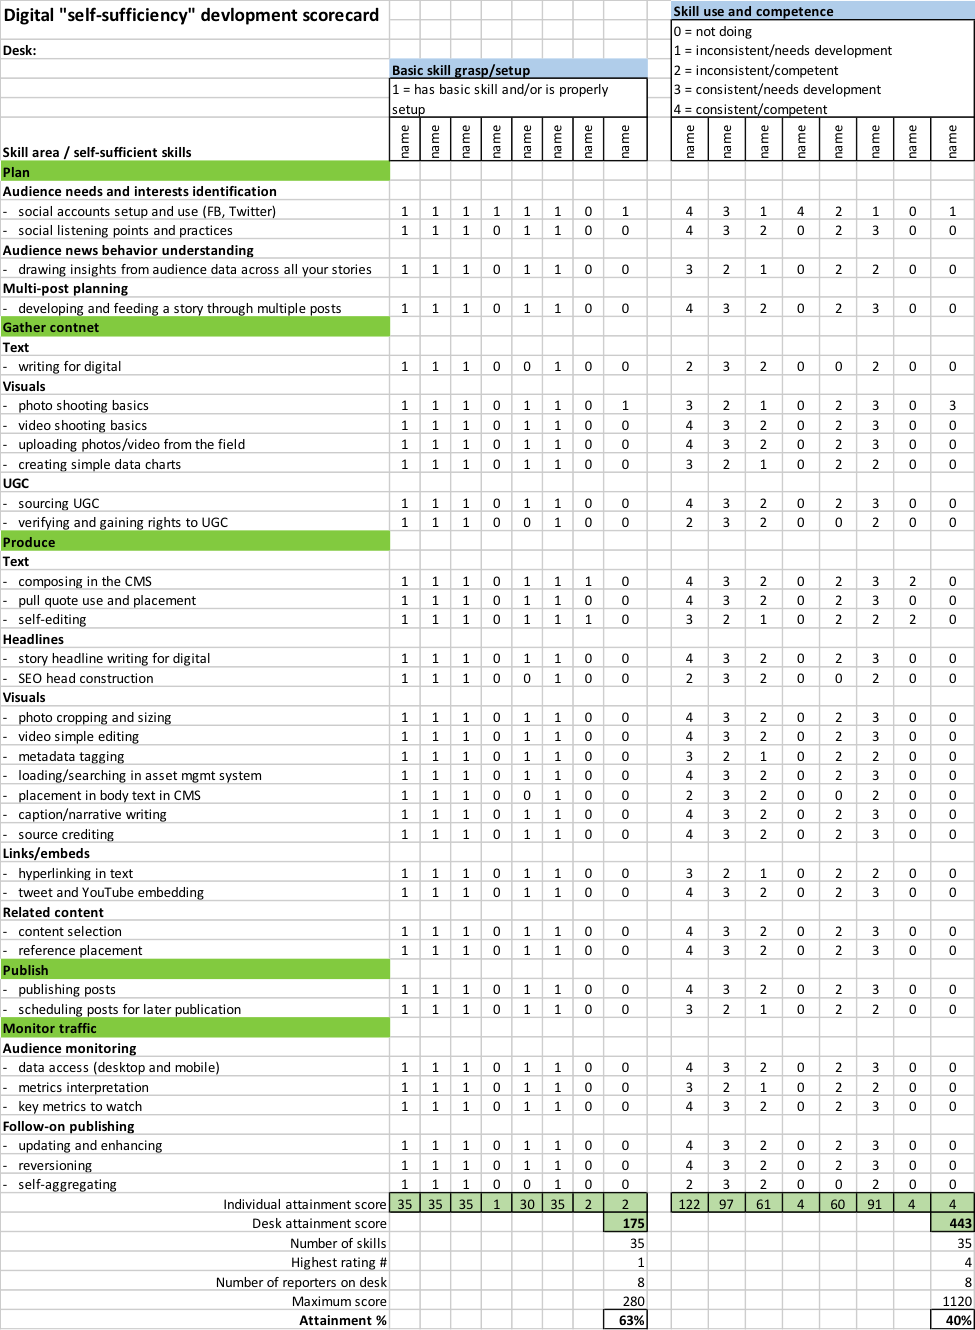
- Naming the individual contributors on desks and setting a scale for proficiency at the required skills. Be careful not to make this scale too cumbersome – perhaps use 1 to 3 or 1 to 4. The illustration below makes the scale binary: either the individual has the skill (“1”) or not (“0”). List the all individuals on the desk that this scorecard covers.
- Monitoring the actual usage of the skill in question. Audiences are ill served by folks who have the needed skills yet don’t use them. The illustration has a 0 to 4 scale for usage. You can alter that however you like – but again, be careful to avoide too much complexity.
- Summarizing the picture with overall scoring mechanisms. Add a section for “doing the math” by specifying the factors for scoring, determining the score for 100% attainment, and then calculating the current level of attainment towards the “at least 80%” target specified in the objective. As you’ll see, the desk in question in the illustration does better on skill attainment (63%) than effective usage of those skills (40%).
