Pushing weather coverage beyond the basics
Erica Smith, Times Union,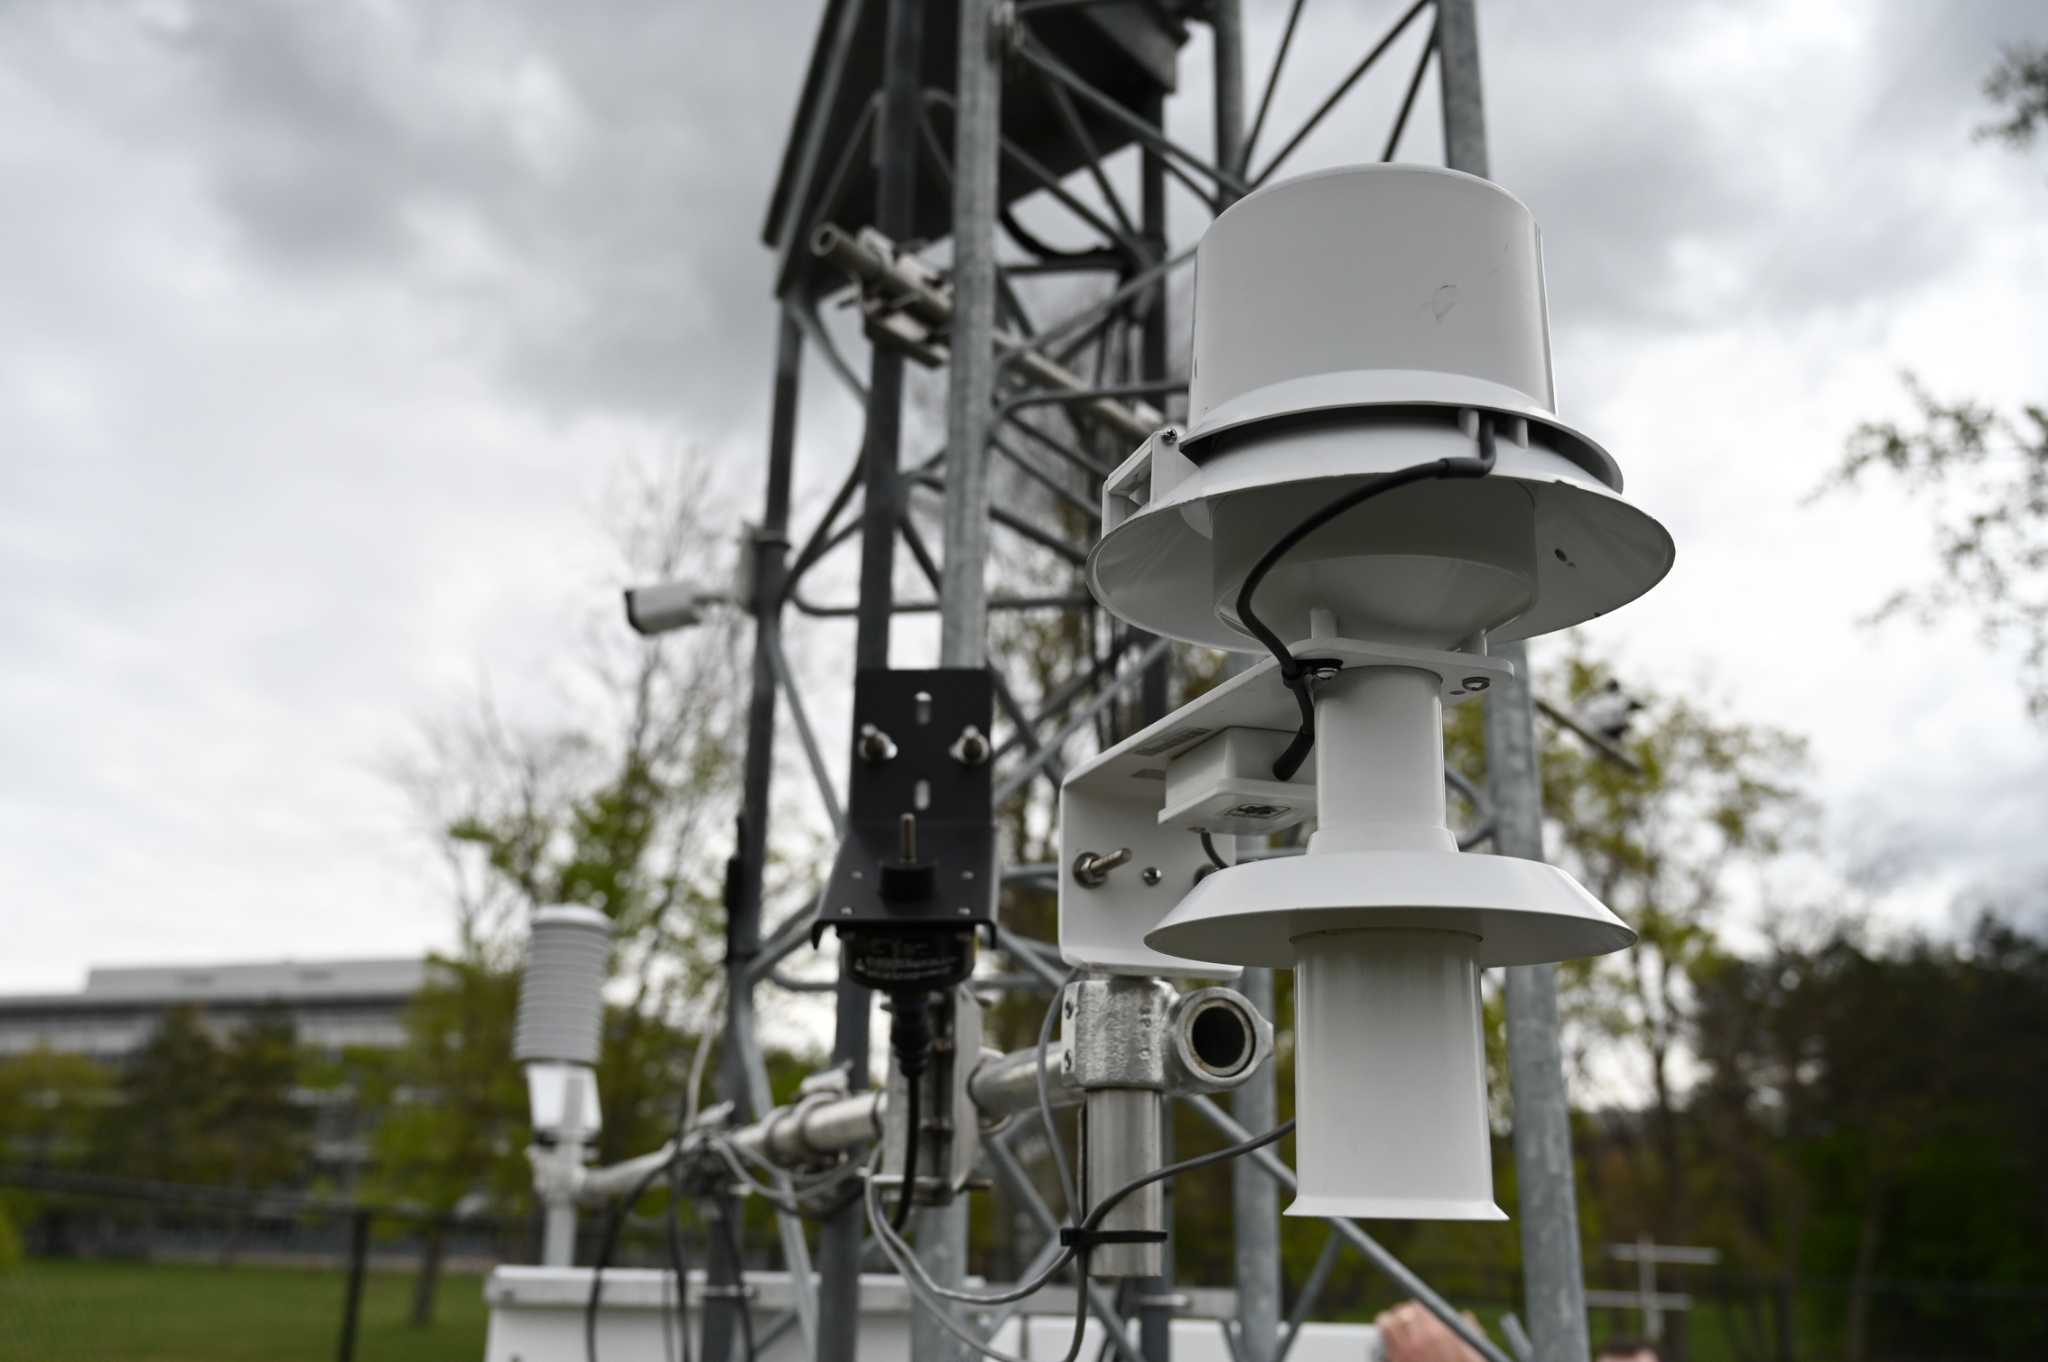
NYS Mesonet weather station sensors collect data at the State University of New York at Albany on May 5, 2023, in Albany, N.Y. NYS Mesonet is a network of 126 weather stations across the state that feeds data in real-time to aid in weather prediction and meteorological data gathering. (Will Waldron / Times Union)
Here's an idea to steal and adapt: The Times Union partnered with a nearby university to build a data-rich, low-cost weather and climate product.This is a series on Better News to a) showcase innovative/experimental ideas that emerge from the Knight-Lenfest Newsroom Initiative and b) share replicable tactics that benefit the news industry as a whole.
This “win” comes from newsletter editor Sarah Diodato, city editor Mike Goodwin, graphics reporter Alexandra Harris, and managing editor for digital Erica Smith at the Times Union in Albany, N.Y, which participated in the 2020-21 Major Market Table Stakes cohort and the American Press Institute-News Product Alliance product development sprint in 2023.
Question: What problem were you trying to solve, and why was that problem strategically important to your organization?
Answer: The San Francisco Chronicle, a sibling in the Hearst family, launched a successful weather initiative in 2022, hiring meteorologists and science writers to tell data-driven stories. We wanted to embark on a similar weather effort but with a much smaller price tag — we didn’t have a budget to hire full- or part-time meteorologists or science writers.
From Metrics for News data and surveys, we knew our readers valued weather reporting. At that point, most of our weather reporting focused on snow events — forecasts, snowstorm trackers, school closings, snow totals and the best local sledding hills.
We knew there was an appetite for more data-driven weather reporting that went beyond snow coverage and what was available in a newscast or weather app.
Q: How did you go about solving the problem?
A: We wanted to lean into the depth and immediacy we knew we could deliver by pursuing two paths:
- Follow the Chronicle formula and write daily forecasts with graphics. We could flip to a live article if circumstances warranted it.
- Partner with the New York State Mesonet at the State University of New York at Albany to access statewide data and create a fellowship program for UAlbany students. The Mesonet is a network of 126 weather stations — at least one in each county and borough — that transmits temperature, precipitation, wind, humidity and pressure data every five minutes.
We expected the daily weather stories to provide readers with need-to-know information and give us a boost in search results and Apple News. Generating area-specific and low-cost forecast graphics became our first unexpected hurdle. We wanted those stories to go beyond the day’s highs, lows and precipitation expectations, and soon found we could do that better on an as-needed basis.
We had written about the Mesonet and knew that TV stations across the state relied on its data. Meeting with Mesonet leaders expanded what we thought was possible. The Mesonet was tracking a lot more than we knew about, and no other media organization was using that data to create web-based graphics and trackers. It also limited some of our plans: Mesonet data is all about what’s happened or is happening now — not what will happen. (Forecasting information is available from the National Weather Service.)
As part of the partnership, we also planned to create a fellowship program that would bring meteorology expertise into our newsroom, give UAlbany students additional writing experience and set up a job pipeline between the university and Hearst properties seeking meteorologists.
Q: What worked?
A: The first product we built with Mesonet data tracks real-time precipitation and temperatures across New York. Since then, we’ve added snow.
The timing lined up with terrible air quality issues across the state, the result of wildfires in Canada. The Hearst DevHub, a shared resource across the Hearst Newspaper group, accelerated the expansion of a California-based air quality tracker for other markets, including New York. Readers loved it, and this tool became pivotal for our summer coverage. That convergence also taught us to plan ahead based on upcoming weather events (snow, spring flooding, etc.) versus trying to build around what’s already happening.
Our real-time trackers, and other products built in the following months, sit at a constant low simmer. Readers are more likely to turn to them, and we’re more likely to promote them, when a snowstorm is approaching, air quality seems off or a storm kicks up. Working this way allows us to highlight relevant trackers and integrate them into our reporting as needed.
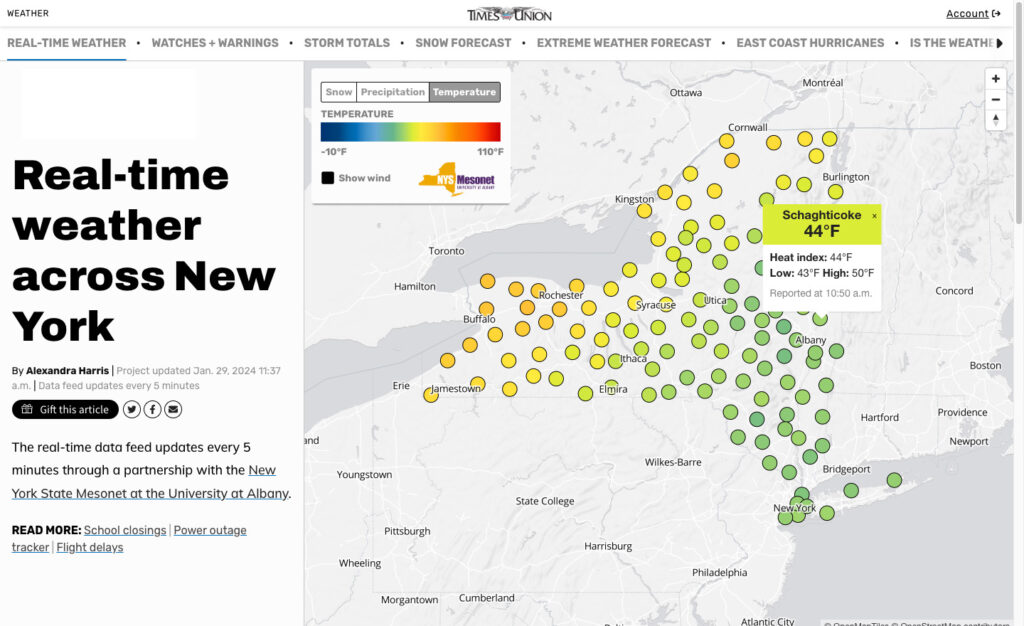
Using data from the NYS Mesonet, the Times Union built a tracker that shows temperature and precipitation in real time. This complements other real-time products, including air quality, power outages and school closings. (Alexandra Harris/Times Union)
In the past 12 months, we’ve published 138 weather stories and trackers, up 10% from the previous 12 months. But visits to weather stories have more than doubled and average read time has increased by a full 20 seconds.
All of our weather trackers are available on our weather page, and each tracker that we’ve built uses a nav bar to link to the other products in the suite. In phase 2, we’re working to make these trackers embeddable within stories.
And while we have specific goals for our weather initiative, we also have two overarching goals as an organization: drive reader revenue through subscriptions and inform the public. While most of our weather reporting is metered, stories that deal with life-and-death events are not: Our snowstorm tracker is not metered, but the real-time temperature and precipitation map is. This is an area where we continue to learn and evaluate, and can quickly make changes as warranted.
We also discovered some gaps: The Mesonet covers the state and updates every five minutes, but some areas of a county may see more or less rain or snow than what the Mesonet reports. The National Weather Service has built a network of trained spotters that report data. We’ve started layering in and building tools with National Weather Service data. While it’s not a full forecast, that also allows us to peer into the future.
Q: What didn’t work?
A: We have not been able to sustain daily forecasts; we’re not staffed to make that happen with good stories that move beyond very basic information. We learned very quickly from our real-time temperature map that people don’t really care about the temperature — many already have that data in their pocket. Precipitation was important, but only when there was a big storm. Weather almost needs sportslike bragging rights to really resonate with a large audience.
We also haven’t found the budget (from the Times Union, University at Albany or grants) to make our fellowship plans a reality. UAlbany students would receive college credit but we believe they also should be paid for their work. We continue to look for funding opportunities, while also working through Plans B and C, which pivot away from the university.
Q: What happened that you didn’t expect?
A: To kick off the project, we created a survey and asked readers what they wanted. We were pleasantly surprised to see a significant interest in climate reporting. We applied for and received a grant through the product development sprint. We then partnered with a freelance reporter to accelerate our climate reporting and determine what types of climate stories work best.
Given that response, we expected climate change stories to be a big hit. It was more hit-and-miss, but some themes have emerged. Perhaps it shouldn’t have surprised us that our top climate stories are about critters and nature — trail cameras and striped bass spawning — versus stories that dive straight into climate change. (The real lesson: Come at it from the side, perhaps with a bear or fish, instead of shouting “climate change” in the headline.)
We were also surprised to find great interest in “space” weather — meteor showers, Northern Lights, rocket launches and the expected visibility of those events.
And while it’s widely known that many people shuttle between New York and Florida throughout the year, we found more interest than expected in storms that hit Florida. In our hurricane tracker, we started posting updates on all East Coast and Gulf of Mexico storms, not just those that would affect New York. We’re now discussing other ways to serve our New York-Florida audience.
Q: What advice would you give to others who try to do this?
A: Start with a survey. Follow with surveys. Talk to people. We get used to guessing what’s important to readers — which stories are promoted on social media, which ones make it to A1 or the top of the homepage, which should lead a newsletter — so it’s easy to overlook this valuable step. In the last year, surveys shaped our weather initiative, helped expand our food newsletter and brought focus to our high school sports coverage.
Most states have a Mesonet, but not all have one built out to each county as we have in New York. The National Weather Service has a lot of great data, but it’s not well organized and it can take a lot of time to find what you need. Befriend your local NWS office.
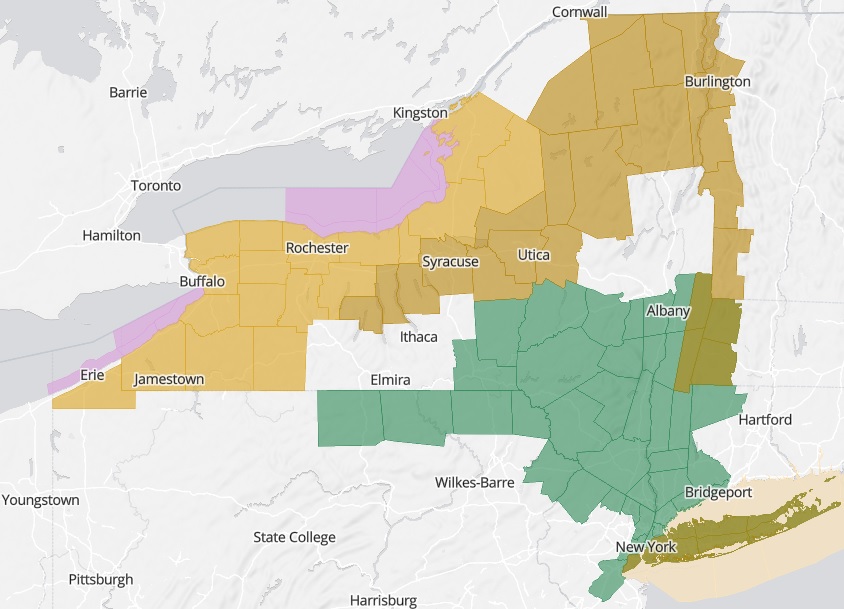
The Times Union created a tracker for weather warnings and watches across the state. A warning is issued when a hazardous event is occurring, imminent or likely. A watch is used when the risk of a hazardous event has increased significantly, but its occurrence, location or timing is still uncertain. (Alexandra Harris/Times Union)
Most of our work would not have been possible without our graphics reporter. The DevHub is an incredible resource, but mostly works on companywide initiatives. Having a graphics reporter on staff — or at least someone who’s not afraid to experiment with data and coding — let us build a real-time weather tracker, a watches and warning map, rain and snow total maps, extreme weather forecasts, a fall foliage tracker, an analysis of the costs of severe weather and more.
Q: What’s next for this work?
A: We continue to refine the trackers we’ve built, evaluate what we’ve done and whether it should continue or be done differently, and look for new opportunities and data sets. Many of our trackers now have an embeddable version that can be added to stories. We’re also looking ahead to and planning for wildfire season.
Our climate coverage continues to evolve. It took us a little time to get past general climate change stories and into those that were more informative and interesting. With so much interest in animal-climate stories, we’re looking at and testing other junctures. History-climate has great promise and high Metrics for News scores.
After identifying the New York-Florida audience opportunity, we’re fielding a survey to find out how we can best serve those readers.
Trust also is important to our weather plans. From the start, we said we wanted to own up to any inaccurate information. In February, a forecast said we’d get at least 8 inches of snow across most of our coverage area. In less than 24 hours, that was revised to “a dusting.” Most of the Capital Region of New York didn’t even get that. We suspect that updating those stories, and explaining how and why those situations come to be, is more important to us than to our readers — something we can see in share volume and social media comments. But we believe the added transparency is worth the effort.