How an impact and reach scorecard helps Carolina Public Press gut-check its journalism
Angie Newsome, Carolina Public Press,This is a series on Better News to a) showcase innovative/experimental ideas that emerge from the Knight-Lenfest Newsroom Initiative and b) to share replicable tactics that benefit the news industry as a whole.
This “win” comes from Angie Newsome, founder and executive director of Carolina Public Press.
Question: What problem were you trying to solve, and why was solving the problem strategically important for your organization?
Answer: Carolina Public Press announced in February an ambitious plan: To scale from a regionally focused nonprofit news organization to the go-to independent, in-depth and investigative news arm in North Carolina. That presents a variety of challenges for our organization, which launched in 2011 with a focus on western North Carolina. Now that we are statewide, we have three major goals — to improve our reach, impact and sustainability. In this case, we wanted to find a way to quantify our impact and measure our reach, story by story, in order to see and track trends — and, therefore, places where we’re doing well and where we need improvement. We have lots — hundreds — of anecdotal stories about how our reporting has made a difference since we launched in 2011. But we wanted to take it a step further. How can we get our reporting into the eyes, ears and hearts of more North Carolinians? And how can we ensure that reporting meets our impact goals, such as improving access to democracy and shining a light on the stories that go overlooked?
Q: How is this approach related to Table Stakes (e.g. one of the 7 Table Stakes and/or an outgrowth of the Knight-Lenfest initiative, etc.)?
A: This scorecard (which is easily adaptable to any newsroom based on your own key performance indicators) gives us the data needed to determine whether we are meeting audience needs (as “proven” by our reach measurements, which include proofs of engagement) and drive audience growth. The whole idea of this was inspired by a call with our coach in the UNC Knight-Lenfest Newsroom Initiative and pushed forward by a need to have a way to quantify our impact over time. While we know certain stories and projects have impact, can we show that that impact is growing? And can we show where? The answers to these questions are integral to our planning process and organization growth, which are major goals of our participation in the Table Stakes program.
Q: How did you go about solving the problem?
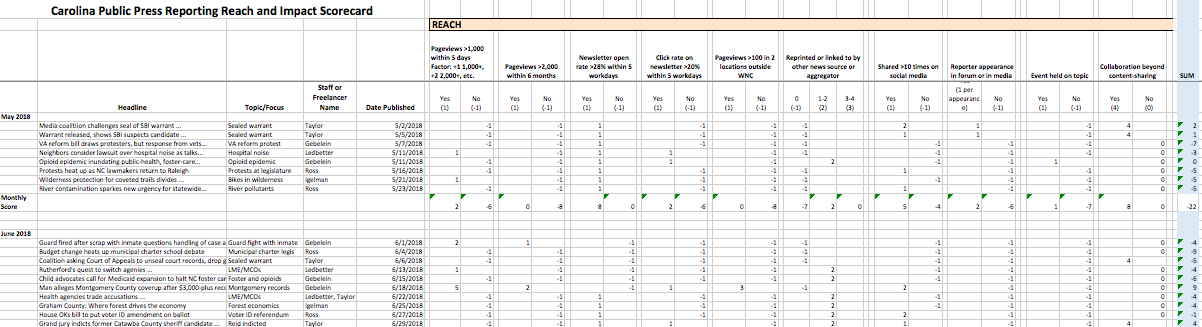
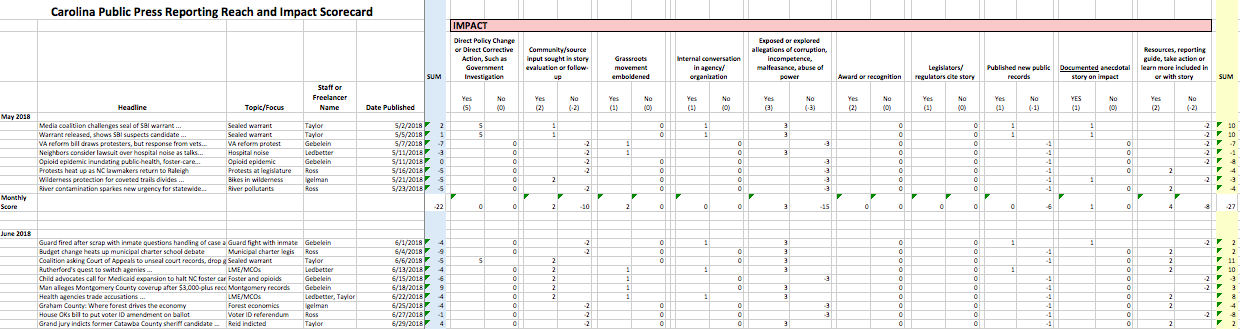
A: We spent time writing down the qualities we hoped each story had — from sparking a government investigation to being read by thousands of users across the state — and putting them into a spreadsheet. We often carried these goals around in our heads, and even talked about them in planning meetings. But we didn’t have a single location where they were captured and regularly referenced. So we created a scorecard in a simple spreadsheet, and we gave a score (e.g. +1, -1, etc.) for each metric to show when we did or didn’t hit those goals.
It’s a relatively simple tool to get toward a complex set of goals. And it allows us, already, to quickly see where we’re doing well — sometimes better than our assumptions — and where there are challenges.
Q: What worked?
A: When we’re in the story-planning process, even at the brainstorming phase, we ask each other what type of score we can expect on our reach and impact scorecard. Some of that discussion has resulted in deciding not to pursue a story. Some of that discussion has resulted in doing a story in a different way. And sometimes, regardless of the score, we decide to do a story anyway. This is also challenging us to look at how we’re approaching some of our reporting, including our state-level government and politics reporting. We’re moving away from a “breaking news” mentality at the state legislature toward one that goes into more analysis of trends and topics, based on how that reporting is scoring over time.
Q: What didn’t work?
A: We started out with, oh, about 25 qualifications too many. That’s unrealistic, because, based on our coach’s feedback, the tool must be simple enough that we keep at it over time. We totally agree! So we went back and simplified the scorecard in a way that didn’t impact its overall goals. And while we’re looking at the scores story-by-story, I believe it will be most illuminating and informative over time, at the month-over-month and quarter-over-quarter perspective.
Q: What happened that you didn’t expect?
A: This scorecard really helped to check our assumptions. I had some precious beliefs that some coverage was doing well and others not so much. But the scorecard allowed me to check that against our goals. And it enabled us to essentially quantify sometimes “mushy” qualitative results of our work — things like whether we pursued collaborations and partnerships and whether we succeeded in efforts to engage our audiences on a story. This gut check is invaluable.
Q: What would you do differently now? What did you learn?
A: Well, honestly, I wish we had done this on Day One. I’ve learned that writing down our goals, specifically, and measuring them story-by-story can only help us get better, not bog us down in unnecessary paperwork and measurements. Hindsight is 20/20!
Q: What advice would you give to others who try to do this?
A: Don’t overthink this (or maybe I’m just talking to myself here), and make it something you can use over time. Design-do! We took about two hours to create the draft, review it and then edit it. Adapt this spreadsheet to your organization’s goals. Talk about it at the top of your editorial planning meetings, both in reviewing past performance and when deciding on future work. Then plan on spending only 30 minutes a day updating it. Overall, we believe it’s a minor investment for major insight into where we’re hitting or missing our performance goals.
Q: Anything else you want to share about this initiative?
A: We’ve been doing this for just a few months and it’s already helped us have a laser focus on our future. Some of the work we’ve done as a part of the UNC Knight-Lenfest Newsroom Initiative is work we wanted to do for years; now we have accountability structure — and the critical coaching — to actually make it happen, to move from lofty goals to measurable outcomes, and to be real about the failures, challenges, opportunities and successes we’re having.